Buying a new car in Australia in 2026 isn’t just about the price sticker it's about understanding how much you will really pay for the vehicle and how prices vary by brand and model.
With Australia recording over 1.24 million new car sales in 2025, the third consecutive year of growth, buyers now have more choice and more factors to consider than ever before.
This guide digs into the average new car price in Australia in 2026 for the top five brands and includes detailed pricing tables for every major model from each brand. It also explains how prices are influenced by market trends, vehicle types, and the shift toward SUVs, utes, hybrids, and EVs, all of which shape what you’ll pay.
According to VFACTS data, the top five brands in Australia by sales volume are:
We’ll use this ranking as the foundation for our analysis.
Before we look at the numbers, it’s important to understand how car prices are represented in this article:
Prices shown are typical manufacturer-recommended retail prices (MSRP) before on-road costs such as registration, dealer delivery, and taxes.
We cover entry-level, midrange, and top trim prices so you can see how price increases within a model line change your budgeting.
A brand average price is calculated based on the model price bands and typical sales mix; for example, a brand with strong SUV and ute sales will have a higher average.
Real purchase prices can vary by dealer, options selected, finance, and local incentives.
Before diving into specific brands, it’s worth noting the broader trends shaping car prices in 2026:
SUVs and utes once again dominate sales, with models like the Ford Ranger and Toyota RAV4 among Australia’s most popular vehicles.
Compact car sales have slowed as customers shift toward larger vehicles.
Hybrid and electrified vehicles are increasing in number but still make up a smaller share of total sales relative to petrol and diesel models.
These trends affect price averages because larger SUVs and utes typically sell for more than smaller passenger cars.
Toyota continues to be Australia’s best-selling brand by a wide margin, with nearly 240,000 vehicles sold in 2025. Its lineup includes a broad range of body types from city cars to large SUVs and utes, meaning Toyota’s average price reflects this diversity.
Toyota Model | Entry Price | Mid-Range Price | Top Trim Price |
Toyota Corolla (Hatch/Sedan) | $34,972 | $40,500 | $44,066 |
Toyota Corolla Cross | $40,302 | $48,000 | $57,312 |
Toyota RAV4 (incl. Hybrid) | $45,990 | $55,000 | $66,340 |
Toyota HiLux (Ute) | $37,610 | $55,000 | $79,757+ |
Toyota Land Cruiser Prado | $78,109 | $90,000 | $111,352+ |
Toyota average new car price (2026): $55,000
Toyota’s wide product range, from affordable Corolla models to premium SUVs and rugged utes, means its brand average is high but balanced between mainstream and higher-priced vehicles.
Ford is strongly associated with utes and SUVs in Australia. The Ford Ranger remains one of the nation’s best-selling vehicles.
Ford Model | Entry Price | Mid-Range Price | Top Trim Price |
Ford Ranger (Ute) | $40,000 | $60,000 | $75,000+ |
Ford Ranger Super Duty | $75,000 | $85,000 | $95,000+ |
Ford Everest (SUV) | $45,000 | $60,000 | $75,000+ |
Ford Escape (SUV) | $40,000 | $48,000 | $55,000+ |
Ford Mustang (Performance) | $75,000 | $90,000 | $105,000+ |
Ford average new car price (2026): $62,000
Ford’s average price is quite high because of the popularity of its utes and SUVs, many of which are priced above the compact car segment.
Mazda’s strategy focuses on mainstream cars and mid-sized SUVs known for stylish design and driving dynamics.
Mazda Model | Entry Price | Mid-Range Price | Top Trim Price |
Mazda3 (Hatch/Sedan) | $31,310 | $38,000 | $45,000+ |
Mazda CX-30 (SUV) | $35,000 | $42,000 | $50,000+ |
Mazda CX-5 (SUV) | $45,000 | $52,000 | $60,000+ |
Mazda CX-60 (SUV) | $60,000 | $70,000 | $80,000+ |
Mazda MX-5 (Roadster) | $40,000 | $47,000 | $55,000+ |
Mazda average new car price (2026): $47,000
Mazda’s average sits in the mid-range because its lineup skews toward passenger cars and mid-sized SUVs rather than heavy utes.
Kia’s pricing strategy focuses on strong value for entry- and mid-range buyers. It also includes electrified models that add diversity to the range.
Kia Model | Entry Price | Mid-Range Price | Top Trim Price |
Kia Picanto | $19,000 | $21,000 | $24,000+ |
Kia Rio (Small Car) | $20,000 | $24,000 | $27,000+ |
Kia Seltos (SUV) | $28,000 | $35,000 | $40,000+ |
Kia Sportage (SUV) | $35,000 | $42,000 | $50,000+ |
Kia EV3 (Electric SUV) | $47,600 | $55,000 | $63,950+ |
Kia average new car price (2026): $41,000
With some of the cheapest new car prices in Australia, Kia’s average is lower than the other mainstream brands, making it attractive for budget buyers.
Hyundai offers a wide range from value small cars to larger SUVs and has strengthened its offering with electrified versions in several segments.
Hyundai Model | Entry Price | Mid-Range Price | Top Trim Price |
Hyundai i30 (Hatch) | $29,250 | $33,000 | $39,000+ |
Hyundai Venue (SUV) | $29,000 | $34,000 | $39,000+ |
Hyundai Kona (SUV) | $32,000 | $38,000 | $45,000+ |
Hyundai Tucson (SUV) | $38,000 | $46,000 | $55,000+ |
Hyundai Palisade (SUV) | $55,000 | $62,000 | $70,000+ |
Hyundai average new car price (2026): $44,000
Hyundai’s range spans accessible everyday cars and larger SUVs, keeping its average price competitive.
Brand | Average New Car Price 2026 |
Ford | $62,000 |
Toyota | $55,000 |
Mazda | $47,000 |
Hyundai | $44,000 |
Kia | $41,000 |
Ford sits at the top because its portfolio includes high-value utes and large SUVs.
Toyota’s strong SUV and ute lineup boosts its average, despite having lower-priced hatch cars.
Mazda’s mid-range focus keeps it squarely in the middle.
Hyundai and Kia cater to value buyers with competitive pricing in entry and mid segments.
Remember that these are brand averages; your actual price will depend on the specific model, trim level, extras, and dealer offerings you choose.
Understanding brand averages and model price ranges helps you narrow your car budget before visiting dealerships. Here’s how you can use this data:
Entry-level buyers should focus on brands with lower starting prices like Kia and Hyundai.
SUV and family buyers might find better value from Mazda and Toyota, which combine volume pricing with strong resale values.
Work and heavy-use buyers looking at utes may see Ford and Toyota as obvious options but should factor in higher average costs.
The price you pay for a new car is just part of the ownership story. Typical ongoing costs such as fuel, insurance, registration, servicing, and maintenance add up over time.
Recent surveys estimate households spend a significant portion of their weekly budget on car running costs, including fuel, insurance, and maintenance.
A representative weekly breakdown might look like this:
Category | Estimated Weekly Cost | Estimated Annual Cost |
Car loan repayments | $212 | $11,028 |
Fuel | $91 | $4,757 |
Registration/CTP | $33 | $1,700 |
Insurance | $46 | $2,410 |
Servicing & tyres | $36 | $1,859 |
Tolls & parking | $7 | $380 |
Total annual cost (excluding depreciation) | $22,140+ |
This table highlights that while the purchase price is front of mind, the largest ongoing cost over time often comes from finance and fuel.
Multiple forces in the Australian market are driving higher new car prices:
SUV and ute demand: Larger vehicles often cost more than small cars.
Advanced technology: New safety and infotainment systems increase base prices.
Hybrid/electric adoption: Electrified models often cost more up front than petrol equivalents.
Market experts have noted that average new car prices in Australia climbed above the mid-forties in recent years and continue to rise as buyers choose more equipment and technology.
Here are key tips to make smarter decisions when shopping for a new car:
Start with a budget ceiling: Use brand averages to set a realistic target before comparing models.
Compare drive-away prices: MSRP is a starting point, but ask for full drive-away quotes.
Consider total ownership cost: Depreciation, insurance, servicing, and fuel matter as much as purchase price.
Check upcoming releases: 2026 will see new SUVs and hybrid options that may offer better value or new technology.
In 2026 the average new car price in Australia varies significantly by brand, reflecting the types of vehicles most in demand and how brands position themselves in the market.
Ford leads with the highest average price due to utes and larger SUVs.
Toyota sits in a strong middle ground with broad appeal across segments.
Mazda, Hyundai, and Kia provide value-oriented choices across small cars and SUVs.
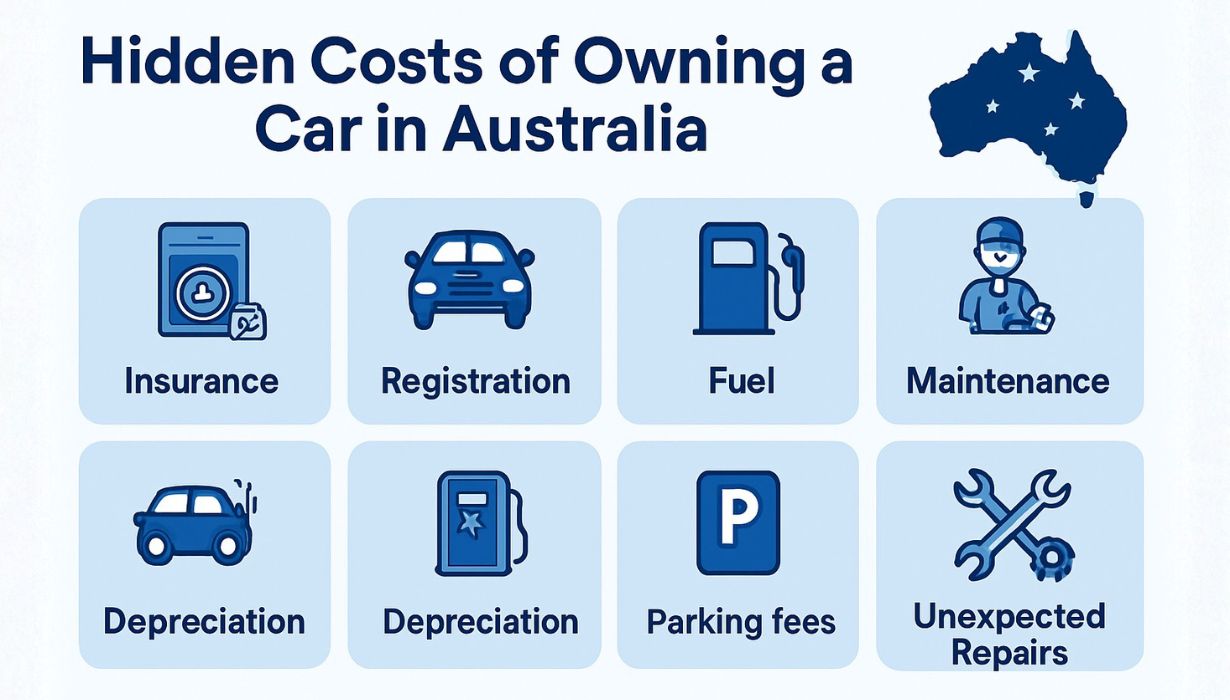
Buying a car is usually the exciting part. The hidden costs are the part that quietly takes money from your bank account month after month. In this deep guide I walk you through the real ongoing costs that most buyers do not plan for. You will get state level context comparisons, examples, and concrete numbers so you can estimate what a car will actually cost you each year in Australia.
This article is based on a broad review of industry data regulator updates and recent market research and I explain my sources where they matter most so you can dig deeper if you want to.
Key takeaways up front
1. Electric vehicles can lower running fuel and maintenance costs but may raise insurance or finance costs for some buyers.
2. Registration and motoring taxes vary by state and can add more than a thousand dollars per year for some vehicles in some jurisdictions.
3. Routine servicing of tyres and unexpected repairs together are often the single largest ongoing cost after finance and fuel. Recent surveys show average capital city households spend around nineteen hundred dollars a year on servicing and tyres.
4. Parking tolls and city parking can easily add hundreds or thousands of dollars a year depending on your routine. Toll schedules and quarterly adjustments mean these costs are not static.
5. Depreciation is the biggest hidden cost over the life of a car, and it is rarely considered by first-time buyers when they set a budget.
Why purchase price is only the start
A car purchase decision usually focuses on the sticker price, the loan, and maybe the weekly finance repayment. The full ownership cost includes many recurring and occasional items that add up quickly.
Below I break these down into the predictable ongoing categories and the less predictable incidental costs
The predictable recurring items are
1. Finance interest and loan fees if you borrow
2. Registration and compulsory third party insurance where applicable
3 Routine fuel or charging costs
4. Regular servicing and tyres
5. Comprehensive or third party insurance premiums
The less predictable but often expensive items are
1. Depreciation over the ownership period
2. Major repairs after accidents or mechanical failures not covered by warranty
3. Unexpected one off costs such as dealer escape fees administration fees or stamp duty when you buy or change registration location
4. Parking fines, towing, and storage fees
5. Tolls for routine motorway commutes
Each of these matters to your household budget. I now go into each category with numbers comparisons and examples
Depreciation: The silent wealth transfer
Depreciation is the loss in market value of your car year on year. It is the cost most people forget because it is not a cash outlay until you sell or trade in. Yet over five years depreciation can be half or more of a new car price for many models which makes it the single largest ownership cost for most buyers
Typical patterns and numbers
1. New mainstream small cars often lose twenty to thirty percent of their value in the first year and around forty to fifty percent in five years depending on make and model
2. Premium or luxury vehicles can lose a larger absolute amount, though percentages vary by model and market demand
3. Light commercial vehicles and popular small SUVs often retain value better than large cars in some markets
Example
1. You buy a new car for thirty thousand dollars
2. After three years a typical market depreciation could reduce value to around eighteen thousand dollars depending on condition, mileage, and market demand
3. The implied depreciation cost is twelve thousand dollars over three years, which is equivalent to four thousand dollars per year
How to use depreciation in your planning
1. When comparing finance offers always calculate the expected depreciation impact on equity after two or three years
2. Choose models with stronger resale histories if you plan to trade the car within a few years
3. Consider buying nearly new or certified pre owned cars to avoid the steepest part of depreciation, which occurs in the first year
Source and note
1. Depreciation calculators and insurer and broker guides are useful to estimate model specific rates. These are the best starting points for planning.
Registration taxes and government charges by state
Registration costs vary widely across the states and territories. The transport authorities update fees periodically and some jurisdictions use weight or vehicle price components that make heavier and more expensive vehicles much costlier to register
What to expect
1. Registration often includes a vehicle registration fee a motor vehicle tax and compulsory third party insurance, either separate or bundled into the registration bill
2. Some states announced fee adjustments with indexation, which can push annual registration costs higher over time
Representative example
1. In New South Wales registration fees were increased, and the transport authority noted an annual indexing step, which affects routine renewal amounts. This can add several hundred dollars a year for some vehicle types.
How to plan
1. Check the renewal cost for your vehicle class with the state transport authority before you buy
2. Include the registration renewal amount in your annual ownership budget rather than treating it as a one off expense
Insurance beyond the premium
Most buyers look at the headline premium but not at the details that determine claim outcomes and ongoing policy cost. Insurance has both regular cost and hidden cost dimensions because your choice of excess optional extras and declared use of the car influence both premium and out of pocket cost at claim time
Important points
1. Comprehensive cover reduces the risk of large out of pocket repair bills but costs more in premiums than third party only policies
2. Many mainstream market analyses show average comprehensive premiums in the low to mid thousands per year with wide variation by profile and postcode. Shopping around matters.
Examples to compare
1. A commuter in a major city may pay significantly more than a suburban driver with the same car and claim history because insurers price by postcode risk and local repair costs
2. Electric vehicles can be cheaper to run but may attract higher repair or replacement parts costs, which influence premiums for some models
Tips to reduce insurance impact
1. Increase your voluntary excess if you can afford a larger out of pocket amount when you claim
2. Keep a clean driving history and consider multi policy discounts, such as bundling home and motor with the same insurer
3. Review agreed value options for older vehicles where market value disputes are common
Routine servicing tyres and maintenance
Routine service costs and tyre replacement are regular outlays that are often underestimated. Recent studies show that capital city households spend in the order of nineteen hundred dollars per year on servicing and tire replacement, though this varies by city and vehicle type.
Breakdown and examples
1. Scheduled servicing costs vary depending on manufacturer requirements. Luxury brands can have higher routine servicing costs than mainstream brands
2. Tyre replacement frequency depends on driving style but most drivers will need new tyres every two to four years on average
3. Brake pads, suspension, and other wear items create an ongoing maintenance queue rather than a single large bill
Example cost table approximate national averages per year
Typical annual cost range
Scheduled servicing: $400 to $1200
Tyres replacement amortised: $200 to $600
Consumables oil filters wipers: $100 to $300
Unexpected small repairs: $200 to $800
Total servicing and tyres: $900 to $2900 per year based on vehicle and usage
How to control these costs
1. Follow manufacturer service intervals but compare independent workshops for routine maintenance where warranties permit this
2. Use tyre rotation and alignment to extend tyre life
3. Keep a maintenance log to avoid small issues becoming costly failures
Fuel and charging cost comparison
Fuel and electricity are recurring costs that scale with the kilometers you drive. Fuel price fluctuations mean annual cost estimates need periodic revision. The national average petrol price moves with global oil markets, local taxes, and exchange rates, and recent reports show city by city differences and quarter to quarter variation, which affects running costs.
Representative calculation using typical efficiencies
1. A small petrol car consumption eight litres per one hundred kilometres at one seventy five cents per litre results in an annual fuel bill for fifteen thousand kilometres of roughly two thousand one hundred dollars
2. Hybrid vehicles at four and a half litres per one hundred kilometres at the same fuel price results in around eleven hundred dollars per year
3. Electric vehicle at fifteen kWh per one hundred kilometres with an off-peak electricity rate of thirty cents per kWh results in around six hundred seventy five dollars per year with home charging
How to use this
1. Estimate your annual kilometres and apply realistic vehicle consumption numbers to find your annual fuel or charging bill
2. Factor in public charging higher per kWh costs where relevant and fast charging premiums for long trips
Parking and tolls the urban surprise
Commuters and city workers encounter parking and toll costs every day, which add up fast. Parking rates vary by city and location, and tolls are adjusted periodically, which means a routine commute that looks cheap on a map can be expensive in practice. Recent toll operator updates show regular quarterly adjustments and city by city toll ranges.
Examples
1. A daily toll of fifteen dollars for a weekday commute eighty working days per year is twelve hundred dollars a year
2. City parking for work at an average of twenty dollars per day for two hundred workdays is four thousand dollars a year
Practical planning
1. Consider public transport or park-and-ride options for daily commuting where possible
2. Negotiate parking rates with employers or use monthly parking passes, which are often cheaper than daily casual fees
Stamp duty and purchase-related taxes
Stamp duty or motor vehicle transfer taxes are often payable when you buy a car, and the rate depends on the state and the purchase price or, in some cases, the vehicle value bands.
These costs can be hundreds or thousands of dollars for more expensive vehicles and are a material part of the initial purchase cost, which many buyers forget to add into their budget
Action point
1. Check the stamp duty schedule for your state before purchase and include the amount in your total upfront cost
Finance fees, interest, and loan extras
If you finance your car, you pay interest and often additional fees that can materially increase the total amount paid over the loan term. The interest rate depends on your credit history, loan term, and lender. Longer term loans reduce monthly repayment but increase total interest paid
Example
1. A five year loan for thirty thousand dollars at an annual rate of six percent results in interest payments in the thousands over the loan life, which adds to the effective cost of ownership
2 Loan setup fees and early repayment fees can create additional unexpected costs
How to manage
1. Shop around for competitive rates and compare the total repayment, not just the monthly payment
2. Consider a shorter loan term if the monthly payments are affordable to reduce total interest
Warranty gaps and extended warranty traps
Many buyers rely on the manufacturer warranty for peace of mind, but once the warranty expires, major failures can be very expensive, particularly on modern cars with complex electronics.
Extended warranties are sold at the point of purchase but they vary widely in coverage and price
Must Advice
1. Read the fine print before buying an extended warranty and compare the expected out of pocket repairs against the price of the warranty
2. Maintain service records and comply with manufacturer requirements to preserve warranty rights
Putting it all together: Example total cost estimate
This example uses realistic midpoint assumptions for a typical mid-sized commuter vehicle with financing to show how hidden costs accumulate
Assumptions
1. Purchase price: $28,000 financed over five years at six percent annual interest
2. Annual distance: 50,000 kilometres
3. Moderate city parking and occasional tolls
Approximate annual costs
Category: Annual cost estimate
Finance interest and principal amortised: $7 000 approximate effective annual cost including principal and interest
Depreciation amortised: $4 000
Insurance comprehensive average: $1 500
Registration and CTP: $600
Fuel or charging: $1 500
Servicing tyres and maintenance: $1 500
Parking and tolls: $1 200
Total annual ownership cost: $17 300
This rough example shows how actual ownership cost can be many times the headline finance repayment that buyers focus on. Your numbers will vary but the categories are consistent for all owners
Checklist to avoid shocks and keep ownership costs low
1. Calculate expected depreciation for your model and use it to compare new versus nearly new options
2. Get at least three insurance quotes compare agreed value and excess options and confirm repairer network details
3. Check your state-specific registration renewal and stamp duty schedules before purchase
4. Estimate your real annual kilometres and compute fuel or charging costs using realistic consumption numbers
5. Review parking options and toll routes for your regular commute and account for them annually
6. Maintain the car properly and shop around for routine servicing to reduce lifetime repair costs
7. Consider buying certified pre owned vehicles to avoid steep first year depreciation
Final thoughts
Buying a car is a commitment that extends beyond the monthly finance repayment. Depreciation, registration, insurance, servicing, parking tolls, and occasional repairs together form the real ongoing cost of ownership.
Planning for these costs upfront and using model-specific research and quote comparison will protect your household budget and prevent unwelcome surprises
Selected sources for the most important figures and recent market context
1. Industry research on comprehensive insurance averages and variation by profile.
2. State transport authority information on registration fee indexation and recent changes.
3. Recent survey data on servicing and tyre costs for capital city households.
4. Petrol price quarterly reports and sector updates showing city-level variation.
5. Depreciation guides and calculators that show expected value loss over time.
If you would like I can convert this into a printable one-page budget planner with editable fields for your exact postcode vehicle make and kilometres so you can get personalised annual cost estimates right away
Purchasing car insurance in Australia is one of those adult choices that can change your budget more than you expect. The question of choosing third party or comprehensive cover is not only about price. It is about what risks you want managed for you, how you use the car, and what you can afford if something goes wrong.
This article explains the real differences between third party and comprehensive car insurance in practical terms, shows representative costs with data and state-level context and gives clear examples so you can choose the right cover for your situation
This article draws on regulator guides, industry reports, and large market quote studies to build a practical comparison you can use when shopping for insurance in Australia. Key sources are MoneySmart, the Insurance Council, and recent market analysis from consumer research firms.
1. What do third party and comprehensive policies actually cover
Third party property damageThird party property damage covers damage you cause to other people's vehicles, fences, buildings, or other property. It does not cover damage to your own vehicle. You remain financially responsible for repairing or replacing your own car unless you purchase an additional product that adds fire and theft cover.
Third party property damage, fire, and theft This option is third party property damage with an additional layer that will pay for your car if it is stolen or damaged by fire. It still does not cover your vehicle after most accident scenarios where you are the driver at fault.
Compulsory third party, also known as CTPCompulsory third party insurance protects other people if they are injured in a crash you cause. This is mandatory and is often bundled into your vehicle registration in most states. CTP does not pay for vehicle damage. It addresses personal injury medical costs, rehabilitation, and, where applicable, compensation claims. The rules and how CTP is managed differently by jurisdiction, so check your state regulator for exact arrangements.
Comprehensive cover Comprehensive car insurance covers damage to your own vehicle as well as damage you cause to other vehicles or property, depending on the policy wording. Comprehensive policies typically include theft and weather and fire related damage and often include optional extras such as new car replacement, hire car after an accident, and agreed value cover. Comprehensive is the broadest form of private motor insurance in the market.
2. The simple comparison table for quick reference
Below is a simple table you can use to compare the main features of each policy type:
3. Cost direction and representative numbers
Insurance premiums depend on many factors. The same car insured under third party cover and comprehensive cover will usually show a large price difference because comprehensive pays for many more risk outcomes.
Representative national level analysis from market researchers shows that average comprehensive premiums in recent market studies fall into a broad range from roughly seventeen hundred dollars to over twenty seven hundred dollars per year, subject to driver profile, vehicle model, and postcode.
Third party and third party fire and theft products are significantly cheaper in most cases, but the precise saving depends on the insurer and product design.
Important contextual points about cost
The younger the policy holder and the higher the annual kilometers, the higher the premium tends to be
Postcode matters a lot because theft and accident frequency vary by suburb and state
Optional extras such as agreed value and new car replacement add materially to the premium
Excess choice and multi policy discounts change the headline price
4. Why people still choose third party cover
Affordability is the main reason. If the car is low value, the cost to insure it comprehensively can be a significant portion of the vehicle's market value
Many drivers use very old vehicles as second cars or for occasional use and accept that they will self insure for damage to their own car
In some regional areas repair costs may be lower and the perceived benefit of comprehensive cover is smaller
Example one
A twenty year old small hatchback worth around two thousand dollars may cost four to six hundred dollars a year for third party property damage, whereas comprehensive cover for the same vehicle may cost five to eight hundred dollars or more, making third party a rational choice for the owner
5. Why people choose comprehensive cover
Comprehensive protects you against the cost of repairing or replacing your own vehicle after an accident even if you are the driver at fault
It often includes weather, theft, and vandalism cover and sometimes offers extras like new car replacement for vehicles below a specified age
Comprehensive reduces the personal financial shock that can follow a serious accident
Example two
A family with a seven year old medium sedan worth twenty five thousand dollars is likely to prefer comprehensive coverage because repairing or replacing the vehicle out of pocket would be a major financial burden.
Even if comprehensive adds several hundred dollars a year the reduced risk of a catastrophic out of pocket bill makes the coverage worthwhile
6. How third party options interact with compulsory third party
Compulsory third party or CTP, is separate from private comprehensive or third party property damage cover
CTP protects other people for personal injury and is mandatory in every state and territory
If you choose third party property damage or comprehensive for your motor insurance, you still must satisfy the CTP requirements for your vehicle registration
Understanding that these layers are separate is crucial because paying for third party property damage does not mean you are not liable for an injured person's medical or rehabilitation costs, which are managed under the CTP framework in each state.
7. Practical cost comparison and examples using common driver profiles
The following scenarios are modeled to show typical relative premiums rather than exact quotes. Insurers price based on many granular inputs so these examples are illustrative
Scenario one: commuter with newer car
Profile
Owner aged 35
Vehicle: a five year old small SUV valued at twenty-eight thousand dollars
Annual kilometers: 18 000
Garaged overnight in a suburban area
Typical market outcome
A third-party property damage quote might be in the lower range, such as three to five hundred dollars a year because it only covers damage to others' property.
Third party property damage, fire, and theft might add another one to two hundred dollars
Comprehensive for this profile could be between eight hundred and fifteen hundred dollars depending on postcode excess and optional extras
Why the gap? Comprehensive pays to repair your own vehicle after accidents, which is costly relative to the narrow third party obligation
Scenario two: retired driver with older vehicle
Profile
Owner aged 68
Vehicle: a ten year old sedan valued at five thousand dollars
Annual kilometers: 8 000
Garaged on private property
Typical market outcome
Third party property damage premiums could be as low as two to four hundred dollars a year if the driver's history is clean
Comprehensive might be higher, say six to nine hundred dollars, which can be unjustifiable if the owner would prefer to self insure for damage to their own car
These scenarios show why the decision often hinges on vehicle value and personal risk tolerance rather than simple price comparison
8. Which option makes sense by vehicle value and use
Low-value car for occasional use Third party property damage or third party fire and theft is often the rational choice
Mid-value car used daily for commuting Comprehensive is commonly the better option because out of pocket repair costs are likely to exceed the annual premium difference
High-value or financed car Comprehensive is typically required by lenders and is usually the only sensible option because of the high cost of repairs or replacement
9. What is not obvious until you read the product disclosure statement
New car replacement clauses often have age and kilometre cutoffs and narrow definitions of what constitutes a total loss
Repairer choice can matter. Some insurers require use of approved repairers, which influences how quickly repairs happen and possibly the quality of repair
Agreed value cover can protect you from market value disputes at claim time but costs more
Always read the product disclosure statement and ask the insurer to explain exclusions before you buy. Regulator guidance emphasizes knowing what is covered and what is not.
10. Extra factors that move the premium a lot
Age and driving history of the primary driver
Postcode and where the car is parked overnight
Vehicle make, model, and engine size
Annual kilometres and declared use such as business or ride share
Excess amount and whether you take optional extras
Market analysis of over sixty seven thousand quotes found that switching providers can often create savings in the hundreds per year, which points to the value of regular shopping around.
11. How to choose in practice step by step
Estimate the market value of your car and compare that to the annual premium difference between comprehensive and third party options
If your own car's replacement cost would create severe financial stress, prefer comprehensive cover
If you drive little and the car is low value, third-party fire and theft is a sensible compromise in many cases
Get at least three personalised quotes and compare the same cover levels excess amounts and optional extras
Consider telematics or low-mileage options if available and appropriate for you
12. A short checklist of questions to ask your insurer
What is the policy excess for at-fault and not at fault claims
Does the policy include new car replacement and what are the limits and time cutoffs?
Will my policy pay for a hire car while my car is being repaired
Do I have the right to choose the repairer and what warranty is provided on repairs
Are there usage restrictions such as business use or ride-share exclusions
13. Final practical advice
For older, low-value cars third party property damage or third party fire and theft will often be the cheapest rational choice
For financed and high value cars comprehensive is usually the right choice and may be required by your lender
For daily commuters, mid-value cars comprehensive gives the strongest protection against a single bad accident turning into a large financial shock
Always shop and compare annually and check the product disclosure statement for exclusions and limits
Sources and notes
MoneySmart Australian Securities and Investments Commission Choosing car insurance guide. This is the regulator's guide to policy types and choices.
Canstar market analysis and star ratings, which publish average comprehensive premium ranges and long term trend analysis.
Insurance Council of Australia motor insurance policy paper, which explains industry wide cost drivers and recommendations.
State regulator CTP guidance for details on compulsory third party arrangements.
Buying a car is only the start of the expense. Ongoing costs matter more over time, and car insurance is one of the biggest regular bills owners face. This guide explains how much car insurance costs in Australia today, shows the average prices by state and territory, compares what drives those differences, and gives practical examples and money saving ideas you can use straight away.
I looked across industry research, regulator reports, and insurer commentary to pull numbers and explain variations. Different studies use different methods, so I show ranges where appropriate and always explain the source of each figure. Key takeaways appear up front, and detailed state level comparisons follow.
Quick summary of what you need to know
The national average for comprehensive car insurance has been rising and sits in the low thousands of dollars per year for many drivers.
Premiums differ a lot by state and territory because of factors such as crash and theft rates, repair costs after natural disasters, and local insurance design.
Some states, like Tasmania, have historically reported much lower average premiums than major population states such as Victoria and New South Wales.
Comparing policies matters. Two drivers in the same suburb can receive very different quotes depending on the insurer, cover type, excess, and optional extras.
The rest of this article explains the data in detail and gives examples you can use to estimate your own quote.
What counts as car insurance cost
When we talk about car insurance cost in this guide, we focus primarily on comprehensive cover because it is the policy type that shows the largest variation and the greatest impact on household budgets. Comprehensive policies typically pay for repair or replacement of your vehicle after an accident or theft and also cover damage caused by weather related events depending on the product.
Cost components that influence premiums include
Policy type, such as comprehensive third party or third party property only
Vehicle make, model, and age
Driver profile including age driving history and address
Annual kilometres and typical use, such as commute or business use
Chosen excess and optional extras such as new car replacement or hire car after an accident
When sources publish average premiums, they often use different sample vehicles and driver profiles. That is why the precise average numbers vary between research providers. I use recent industry and regulator publications and explain methodology where needed.
National picture and recent trend
Recent research shows rising premiums, but the rate of increase has slowed from the shock increases seen earlier in the decade. Canstar Research found the typical comprehensive policy in 2025 increased versus the prior year by a mid single digit percentage and that switching providers remained a strong way to save. The Insurance Council and industry commentary point to rising repair costs and natural catastrophe claims as the structural drivers of higher premiums.
To put a figure on the national average, consider the following representative estimates from recent studies
Canstar reported an average comprehensive premium in the low two thousands in 2025 with variation by state.
The Insurance Council analysis and regulator reports show much lower averages in Tasmania when measured on some government insurer bases and much higher averages in states that have seen steep increases due to theft and severe weather.
These differences matter because the same increase in dollar terms is a higher percentage of income for lower income households and for regionally concentrated populations.
Average comprehensive premiums by state and territory in 2025
Below is a synthesized table that brings together published figures and regulator commentary. Where direct single source numbers exist, I cite that source. Where sources differ, I show a conservative estimated range and explain why. Figures are annual average premiums in Australian dollars for comprehensive cover where available.
Notes on the table and methodology
Some published studies base averages on specific sample vehicles and driver profiles, which changes the headline number. Always check what vehicle model and driver assumptions were used.
Regulator reports sometimes publish averages for government run schemes or particular product classes, such as compulsory third party, which are not directly comparable with comprehensive market averages. I kept the focus on comprehensive market premiums where sources allowed.
Why Victoria and New South Wales show higher averages
There are three reasons Victoria and New South Wales often appear at the top of premium lists
Urban population density means more accidents per kilometer. More accidents translate to higher claims frequency, which pushes premiums up.
Rising vehicle repair and parts costs after 2020 pushed up insurers' repair bills and therefore premiums. This was highlighted in insurer reporting.
Crime patterns such as vehicle theft hotspots increase the cost of comprehensive policies, especially in certain suburbs. Victoria recorded steep increases in theft related claims in recent years, which drove higher premiums in 2024 and 2025.
Example to illustrate effectImagine two identical vehicles driven the same distance, one registered in central Melbourne and the other in a small Tasmanian town. Because of higher claim frequency and vehicle theft risk, the Melbourne registered car could face premiums that are several hundred to over a thousand dollars per year higher than the same vehicle in Tasmania, according to comparative research.
How insurer cost pressures translate into premiums
Insurers face higher costs from multiple directions and pass some portion to premiums. Key cost pressures are
Repair labour shortages and higher parts costs after supply chain disruption
More frequent extreme weather events and natural catastrophe claims in parts of Australia
Rising rates of organised vehicle theft in some metropolitan areas
The Insurance Council and public filings by major insurers document these drivers and the impact on premiums. The takeaway for drivers is that premiums rise both because claims become more expensive to settle and because insurers adjust pricing for future expected losses.
Example scenarios with ballpark premium estimates
These examples are simplified to help you compare possible costs. Real quotes will differ because insurers use many data inputs.
Example: One urban family car
Vehicle: Toyota Corolla 2018, owner aged 45, garaged at night average annual kilometers: 12,000, comprehensive cover with $500 excess
Likely premium in New South Wales $1 300 to $2 000 depending on postcode and insurer
Likely premium in Tasmania: $700 to $1 000 for a similar profile
Example: two young single commuter
The vehicle is a small hatchback. The owner, aged 24, uses car daily to commute. 20 000 kilometres per year comprehensive cover with $1 000 excess
Likely premium in Victoria, $2 400 to $3 500, reflecting experience for younger drivers in high claim suburbs
Likely premium in Queensland: $1 200 to $1 800 depending on local crime and traffic patterns
These scenarios show how much driver age, kilometers, and postcode can change the premium even within the same state. Always get personalized quotes.
Tips to lower your car insurance cost
Compare quotes from multiple insurers regularly because savings of hundreds of dollars are common between providers for the same coverage. Canstar research shows switching can still produce large average savings.
Choose an appropriate excess you can afford; a higher excess usually lowers premium but increases your out of pocket if you claim
Consider optional extras carefully; new car replacement and agreed value increases premiums significantly and are worth it mainly for newer or more specialised cars
Reduce declared annual kilometres and consider telematics or pay per kilometre products if you drive less than the general population; several insurers now offer mileage based discounts
Garage your car overnight or use a secure parking address; insurers often favor lower-risk postcodes in pricing
Bundle policies with one insurer such as home and motor, sometimes results in multi policy discounts but always check the total cover not just headline discount
What about third party only and compulsory third party schemes
Compulsory third party schemes are run differently in each state, and they cover personal injury liability when you injure another person. These are separate from comprehensive motor insurance, and the way they are funded can affect the total cost of having a car.
Some states have separate levies built into registration or separate insurer frameworks, which you will pay in addition to any comprehensive policy. Check your state regulator for exact CTP arrangements. Regulator documents and insurer disclosure will show how this component is charged in your state.
How to use the data in this article to get a quote
Identify your likely premium range from the table above using your state as a starting point
Use the example scenarios that best match your profile to see where you fit in the range
gather three personalised quotes from major insurers and at least one comparison site and one direct insurer quote
Check product disclosure statements for exclusions, excesses, and new car replacement conditions
Revisit your cover choices annually or after changes such as moving house, buying a new car or a change in commute kilometers.
Final thoughts
Car insurance pricing in Australia is shaped by where you live, how you drive, and the type of cover you choose. Data across 2024 and 2025 shows upward pressure on premiums driven by higher repair and claims costs and by shifts in theft and weather patterns. That means the headline national average is useful but not enough. Look at the state and postcode level and compare quotes frequently.
For those focused on saving money, the best tactics remain comparison shopping, higher excess where affordable, and considering telematics or mileage based products if your driving pattern suits them. If you are in a state with higher average premiums, check for local steps you can take to reduce risk, such as improving parking security.

Buying a car in Australia isn’t just about the purchase price running costs can make a much bigger difference over time. Fuel prices, servicing costs, reliability, and depreciation all play a role in how much a car really costs to own.
Many Australian buyers focus on the sticker price, but the smarter question is:
Which cars are actually cheapest to run in Australia in 2026?
In this guide, we’ll compare petrol, hybrid, and electric vehicles using real Australian driving costs, practical examples, and long term ownership insights to help you choose a car that saves money every year.
Whether you’re commuting in Melbourne, driving in Sydney traffic, or doing longer trips across regional Australia, this guide will help you understand which vehicles keep costs low.
What Makes a Car Cheap to Run in Australia?
A “cheap to run” car usually has four important qualities:
Excellent fuel efficiency or low electricity usage
Low servicing costs
Strong reliability
Affordable insurance and parts
In Australia, the biggest running cost difference usually comes from fuel consumption, which is why small petrol cars, hybrids, and electric vehicles dominate this category.
For comparison, we’ll use a realistic driving scenario:
Annual driving: 15,000 km
Petrol price: $1.90 per litre
Electricity: $0.30 per kWh
Cost Comparison by Vehicle Type
Before looking at specific models, let’s compare average running costs by vehicle type.
Electric vehicles are the cheapest to run, but hybrids often offer the best balance between purchase price and running cost.
Cheapest Petrol Cars to Run in Australia
Petrol vehicles can still be very economical if they are small, lightweight, and efficient.
These models remain popular across used cars Australia listings because of their low ownership costs.
Suzuki Swift
The Suzuki Swift is one of the most affordable cars to run in Australia.
Typical fuel economy: 5.5L/100km
Annual fuel cost: $1,567
Why it’s cheap to run:
Lightweight design
Simple engine
Low servicing cost
Affordable tyres and parts
Toyota Corolla (Petrol)
The Corolla is known for reliability and low maintenance costs.
Fuel economy: 6.0–6.5L/100km
Annual fuel cost: $1,710–$1,850
It’s slightly more expensive than the Swift to fuel, but long term reliability keeps ownership costs low.
Kia Picanto
For city drivers, the Kia Picanto is one of the cheapest petrol cars to own.
Fuel economy: 5.0L/100km
Annual fuel cost: $1,425
This makes it ideal for:
First time buyers
Students
Short distance commuters
Cheapest Hybrid Cars to Run in Australia
Hybrid vehicles are becoming extremely popular in Australia because they deliver excellent fuel economy without requiring charging infrastructure.
They perform especially well in city driving conditions.
Toyota Corolla Hybrid
One of the most efficient vehicles available in Australia.
Fuel economy: 4.2L/100km
Annual fuel cost: $1,197
Why it’s popular:
Proven hybrid system
High resale value
Extremely reliable
This is often considered one of the cheapest cars to run in Australia overall.
Toyota Camry Hybrid
The Camry Hybrid is larger but still very efficient.
Fuel economy: 4.5L/100km
Annual fuel cost: $1,282
It’s a strong choice for families wanting low fuel cost without moving to a smaller vehicle.
Toyota RAV4 Hybrid
SUV buyers in Australia increasingly choose hybrid models.
Fuel economy: 4.8L/100km
Annual fuel cost: $1,368
For an SUV, this is extremely economical.
Cheapest Electric Cars to Run in Australia
Electric vehicles have the lowest running cost because electricity is cheaper than petrol and maintenance requirements are lower.
MG4 Electric
Energy consumption: 14–15kWh/100km
Annual charging cost: $675
This makes the MG4 one of the cheapest cars to run in Australia today.
BYD Atto 3
Energy consumption: 15kWh/100km
Annual charging cost: $675
It combines SUV practicality with extremely low running costs.
Tesla Model 3
Energy consumption: 13–15kWh/100km
Annual charging cost: $600–$700
Even though the purchase price is higher, the long term running cost is very low.
Comparison Table: Cheapest Cars to Run in Australia
This shows why hybrids and EVs are becoming more attractive in Australia.
Maintenance Cost Differences
Maintenance is another major factor in running costs.
Petrol cars require:
Oil changes
Engine servicing
Transmission servicing
Exhaust maintenance
Hybrid vehicles reduce engine wear and brake usage. Electric vehicles require the least maintenance because they have fewer moving parts.
Typical maintenance cost comparison over time:
Real 5-Year Running Cost Comparison
Let’s compare total running cost over five years.
This is why EV ownership is growing in Australia.
City Driving vs Highway Driving
Driving conditions in Australia can change which car is cheapest to run.
City driving:
Hybrid vehicles perform best
Regenerative braking saves fuel
Stop-start traffic improves efficiency
Highway driving:
Petrol and hybrid efficiency becomes similar
EVs remain cheapest per kilometre
Why Hybrids Are Booming in Australia
Hybrids are growing quickly because they offer:
Low fuel cost
No charging requirement
Proven reliability
Strong resale value
For many Australian buyers, hybrids are currently the most practical cheap to run option.
Buyer Advice: Choosing the Cheapest Car to Run
Here’s a simple way to decide.
Choose a small petrol car if:
You drive occasionally
Budget is limited
You want the lowest purchase price
Choose a hybrid if:
You drive daily
You want strong fuel savings
You want reliability
Choose an electric car if:
You can charge at home
You plan long term ownership
You want the lowest running cost
Conclusion
The cheapest cars to run in Australia in 2026 are no longer just small petrol cars. Hybrid and electric vehicles now offer significantly lower running costs, especially for drivers covering regular distances. Petrol cars remain affordable to buy, but hybrids and EVs deliver the biggest long term savings.
For many Australians today:
Small petrol cars are the cheapest short term option
Hybrid cars offer the best balance
Electric cars are the cheapest long term choice
Choosing the right vehicle depends on your driving habits, budget, and access to charging.
February 23, 2026
February 13, 2026
Laws, Registration & Insurance
Everything you need to know about hidden costs of owning a car in australia most buyers ignore in Australia.
Read More
Laws, Registration & Insurance
Everything you need to know about third party versus comprehensive car insurance in australia: which one do you need in Australia.
Read More
Laws, Registration & Insurance
Everything you need to know about how much does car insurance cost in australia? average prices by state in Australia.
Read More
Used Cars
Everything you need to know about is it cheaper to buy a new or used car in australia in 2026? full cost breakdown in Australia.
Read More
Car Buying Guides
Everything you need to know about average new car price in australia 2026 by brand (complete guide) in Australia.
Read More
Car Buying Guides
Everything you need to know about hidden costs of owning a car in australia most buyers ignore in Australia.
Read More
Car Buying Guides
Everything you need to know about third party versus comprehensive car insurance in australia: which one do you need in Australia.
Read More
Car Buying Guides
Everything you need to know about how much does car insurance cost in australia? average prices by state in Australia.
Read More
Electric & Hybrid Cars
Everything you need to know about petrol vs hybrid vs electric cars in australia: which is cheapest to run? in Australia.
Read More
$54,227
2025
Automatic
Kingston
9155676
Updated 42 mins ago
$65,374
2026
Automatic
Belconnen
2584550
Updated 9 hours ago
$2,300
2026
Automatic
Belconnen
4832053
Updated 9 hours ago
$90,865
2024
Automatic
Hobart
1611748
Updated 9 hours ago
$23,456
2024
Automatic
Ulverstone
5517748
Updated 9 hours ago
$45,644
2023
Automatic
Belconnen
8780169
Updated 7 hours ago
$8,678
2025
Automatic
Belconnen
9785012
Updated 9 hours ago
$8,678
2025
Automatic
Belconnen
2879013
Updated 9 hours ago